Farewell to 2022: A Final Review of the Markets
Unprecedented Downward Trend
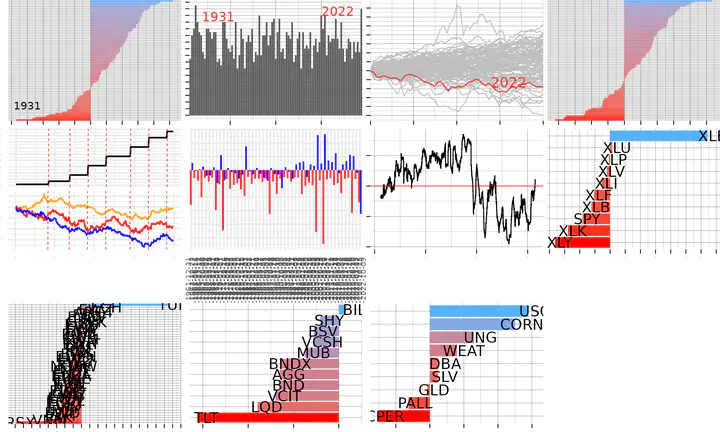
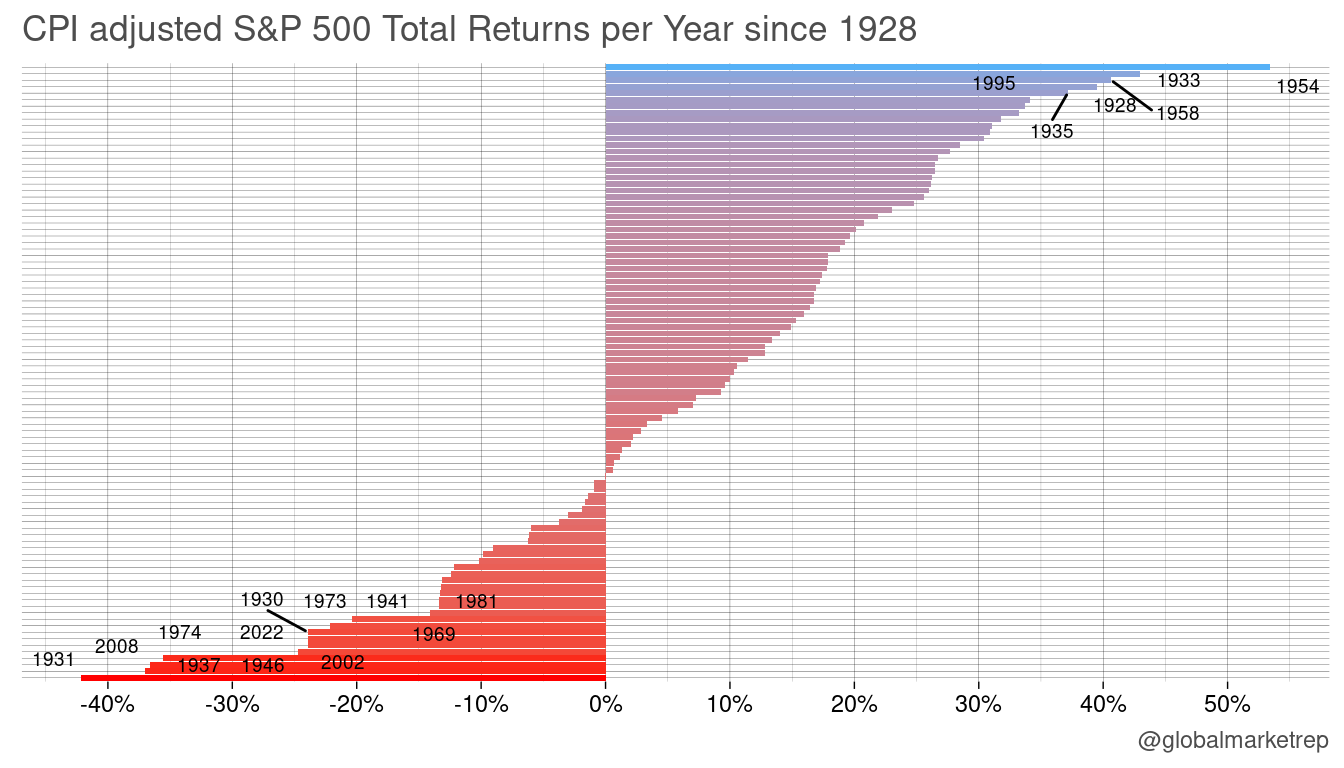
While 2022 has not been the worst year in stock market history, with a loss of -18.1%, the S&P 500 (total return, including dividends) ranks 7th after 2002, 1974, 1930, 1937, 2008, and 1931. The annualized volatility (standard deviation using monthly returns multiplied by the square root of 12) has been 18.8% since 1928, so again, 2022 falls within what a stock investor would typically expect.
There have been two notable aspects of the market in 2022:
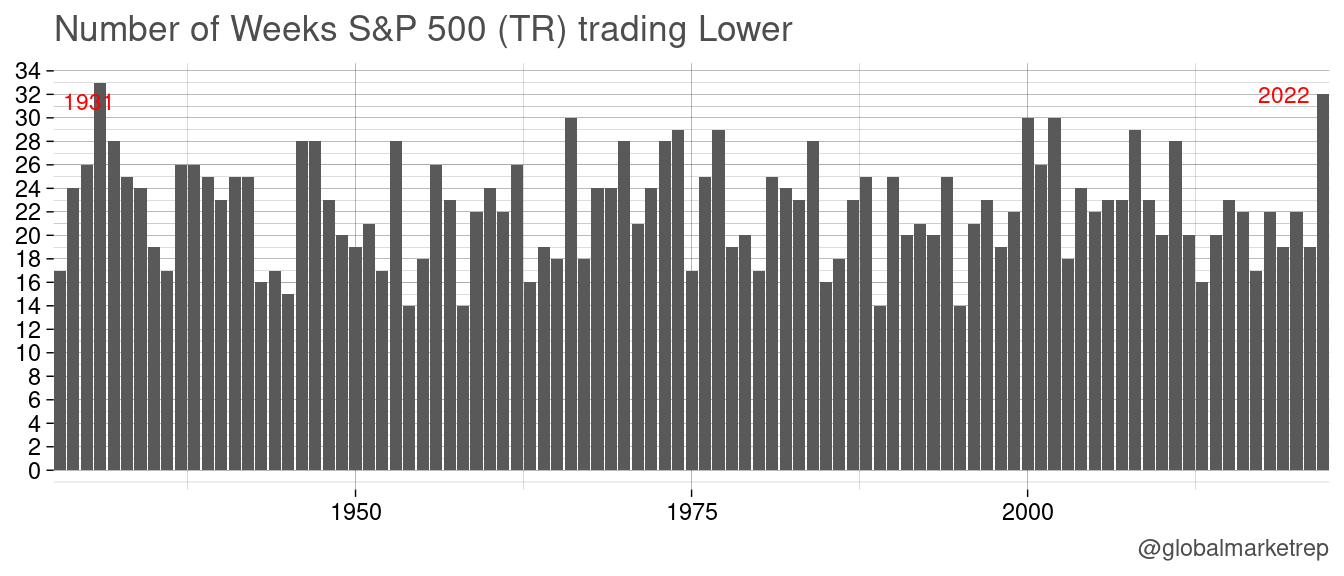
The downward trend was fueled by continuous poor returns throughout the year.
The real return was even worse when corrected for the increase in the consumer price level.
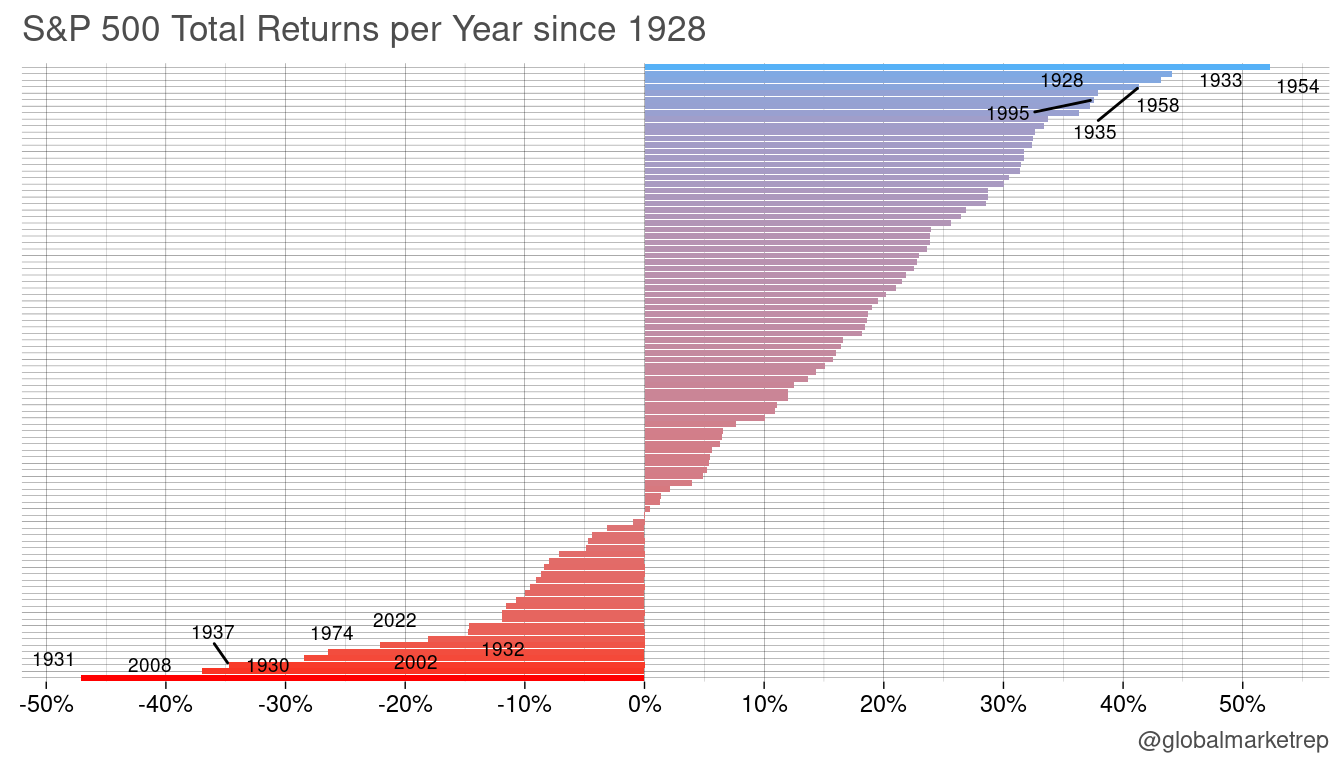
The first point can be illustrated in two charts. First, the proportion of weeks in which stocks traded lower has been higher than ever. In fact, there were 32 weeks in which the S&P 500 TR was down, second only to 1932 with 33 weeks down.
Second, in real terms, stocks did not lose 18.8% but 23.9%. This is because the 2022 inflation rate (using available data from December’s release) was 7.1%.
Fed Rate Hikes
In 2022, the Federal Reserve raised interest rates seven times. Many market participants expect more rate hikes to come in 2023 before the Fed eventually pivots. As a result, short-term interest rates rose from 0% to 4.3% within a shorter time period than ever before in history (from March 17 to December 15, a period of nine months).
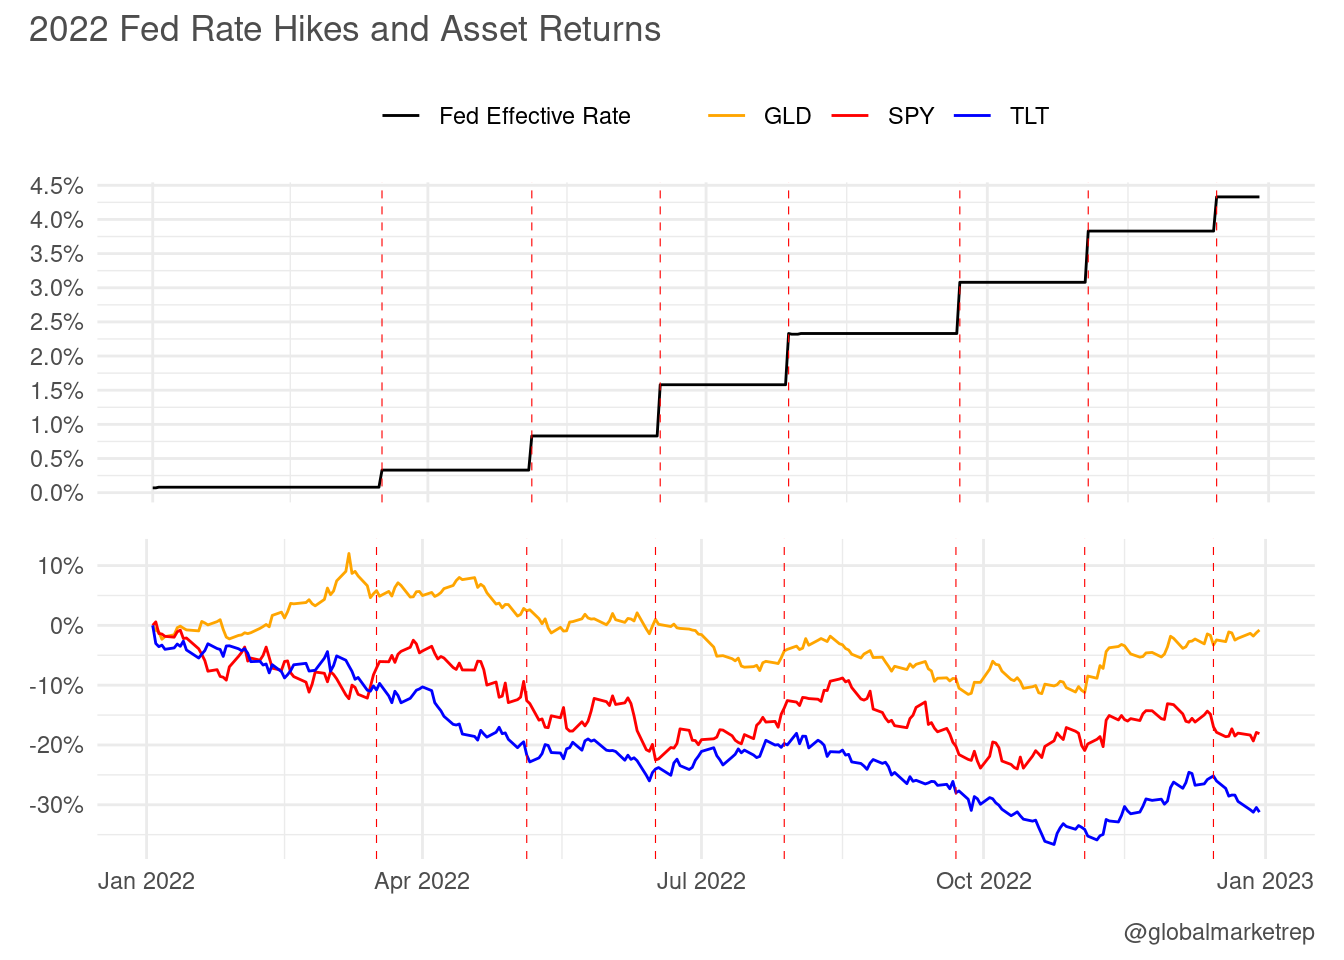
While gold started the first two months of 2022 in the green, it turned downwards in March, suggesting that the market was initially anticipating that the Fed would wait before starting to tighten monetary policy. The asset movements show that the following rate hikes did not come as a complete surprise. The big loser from higher rates was, of course, long-term bonds (TLT) due to the inverse relationship between bond prices and yields.
The loss in Treasury bonds was further amplified by their high duration (the bond’s price sensitivity to interest rate changes) due to the low coupons of Treasury bonds that were issued in recent years.
This resulted in a rare regime of positive correlation between stocks and bonds. While stocks have historically been the go-to hedge during all US stock market drawdowns of at least 10% (especially during the 2000 and 2007 crashes), in the current stock market selloff, long-term Treasuries have lost more than stocks (more than ever in history).
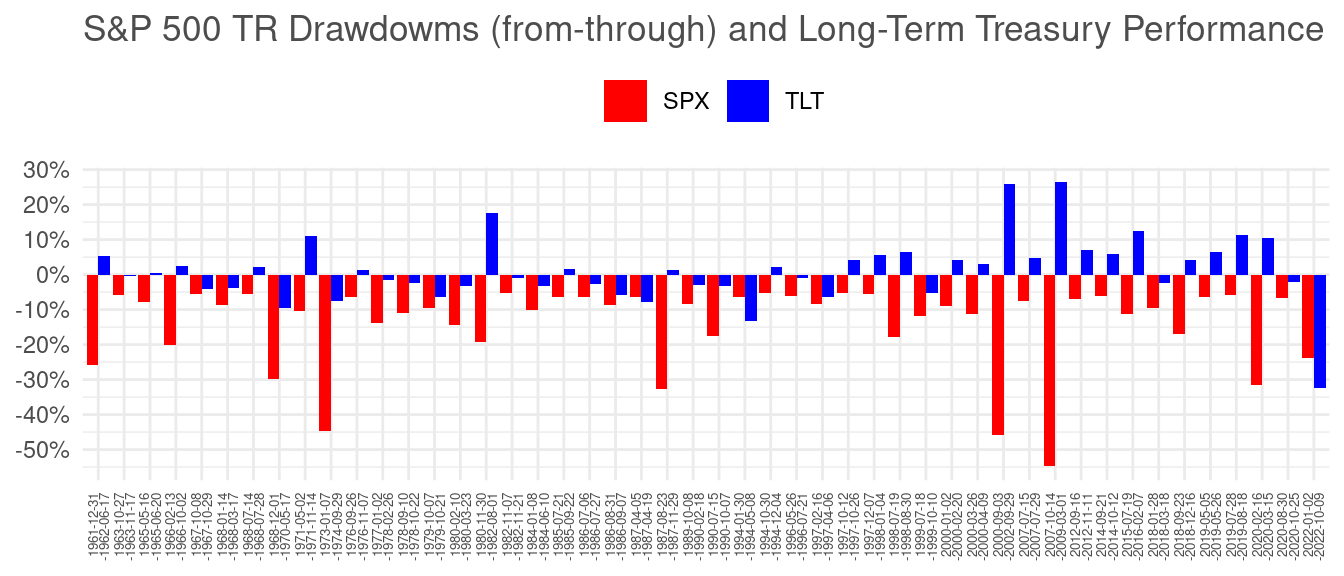
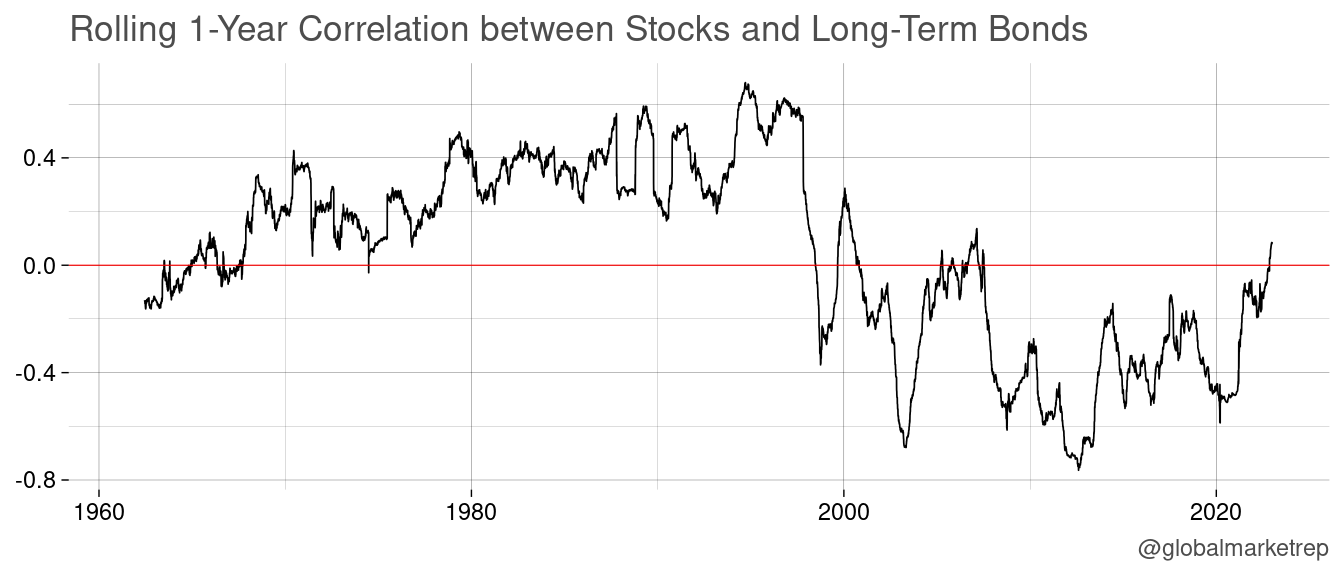
It’s not just the correlations between bonds and stocks that have been positive before (as shown in the next chart). It’s the unprecedented extent to which bonds have lost value, which is mainly attributed to the Fed’s monetary tightening.
2022 Performance
To finish with the year, let’s look at some asset returns.
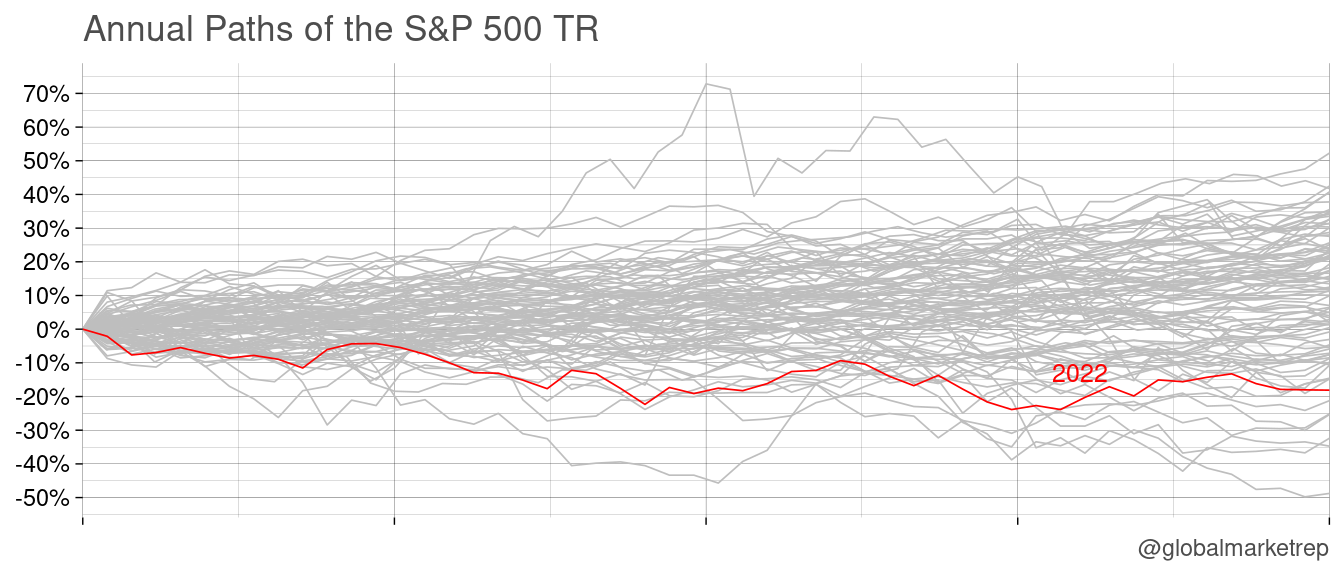
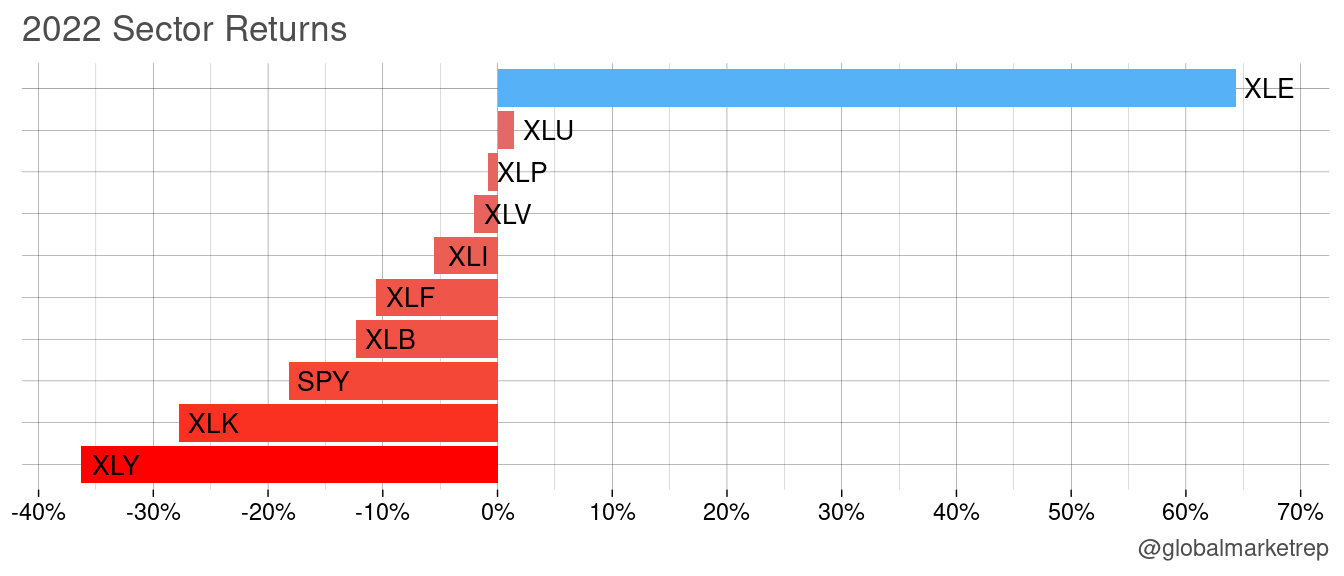
In the comparison of sectors, energy (XLE) was the big winner. Utilities (XL) closed the year just in the green (but, of course, down in real terms). Consumer staples (XLP), healthcare (XLV), industrials (XLI), financials (XLF), and materials (XLB) also performed better than the broad market. On the other end of the spectrum, technology (XLK) and consumer discretionary (XLY) closed with massive losses.
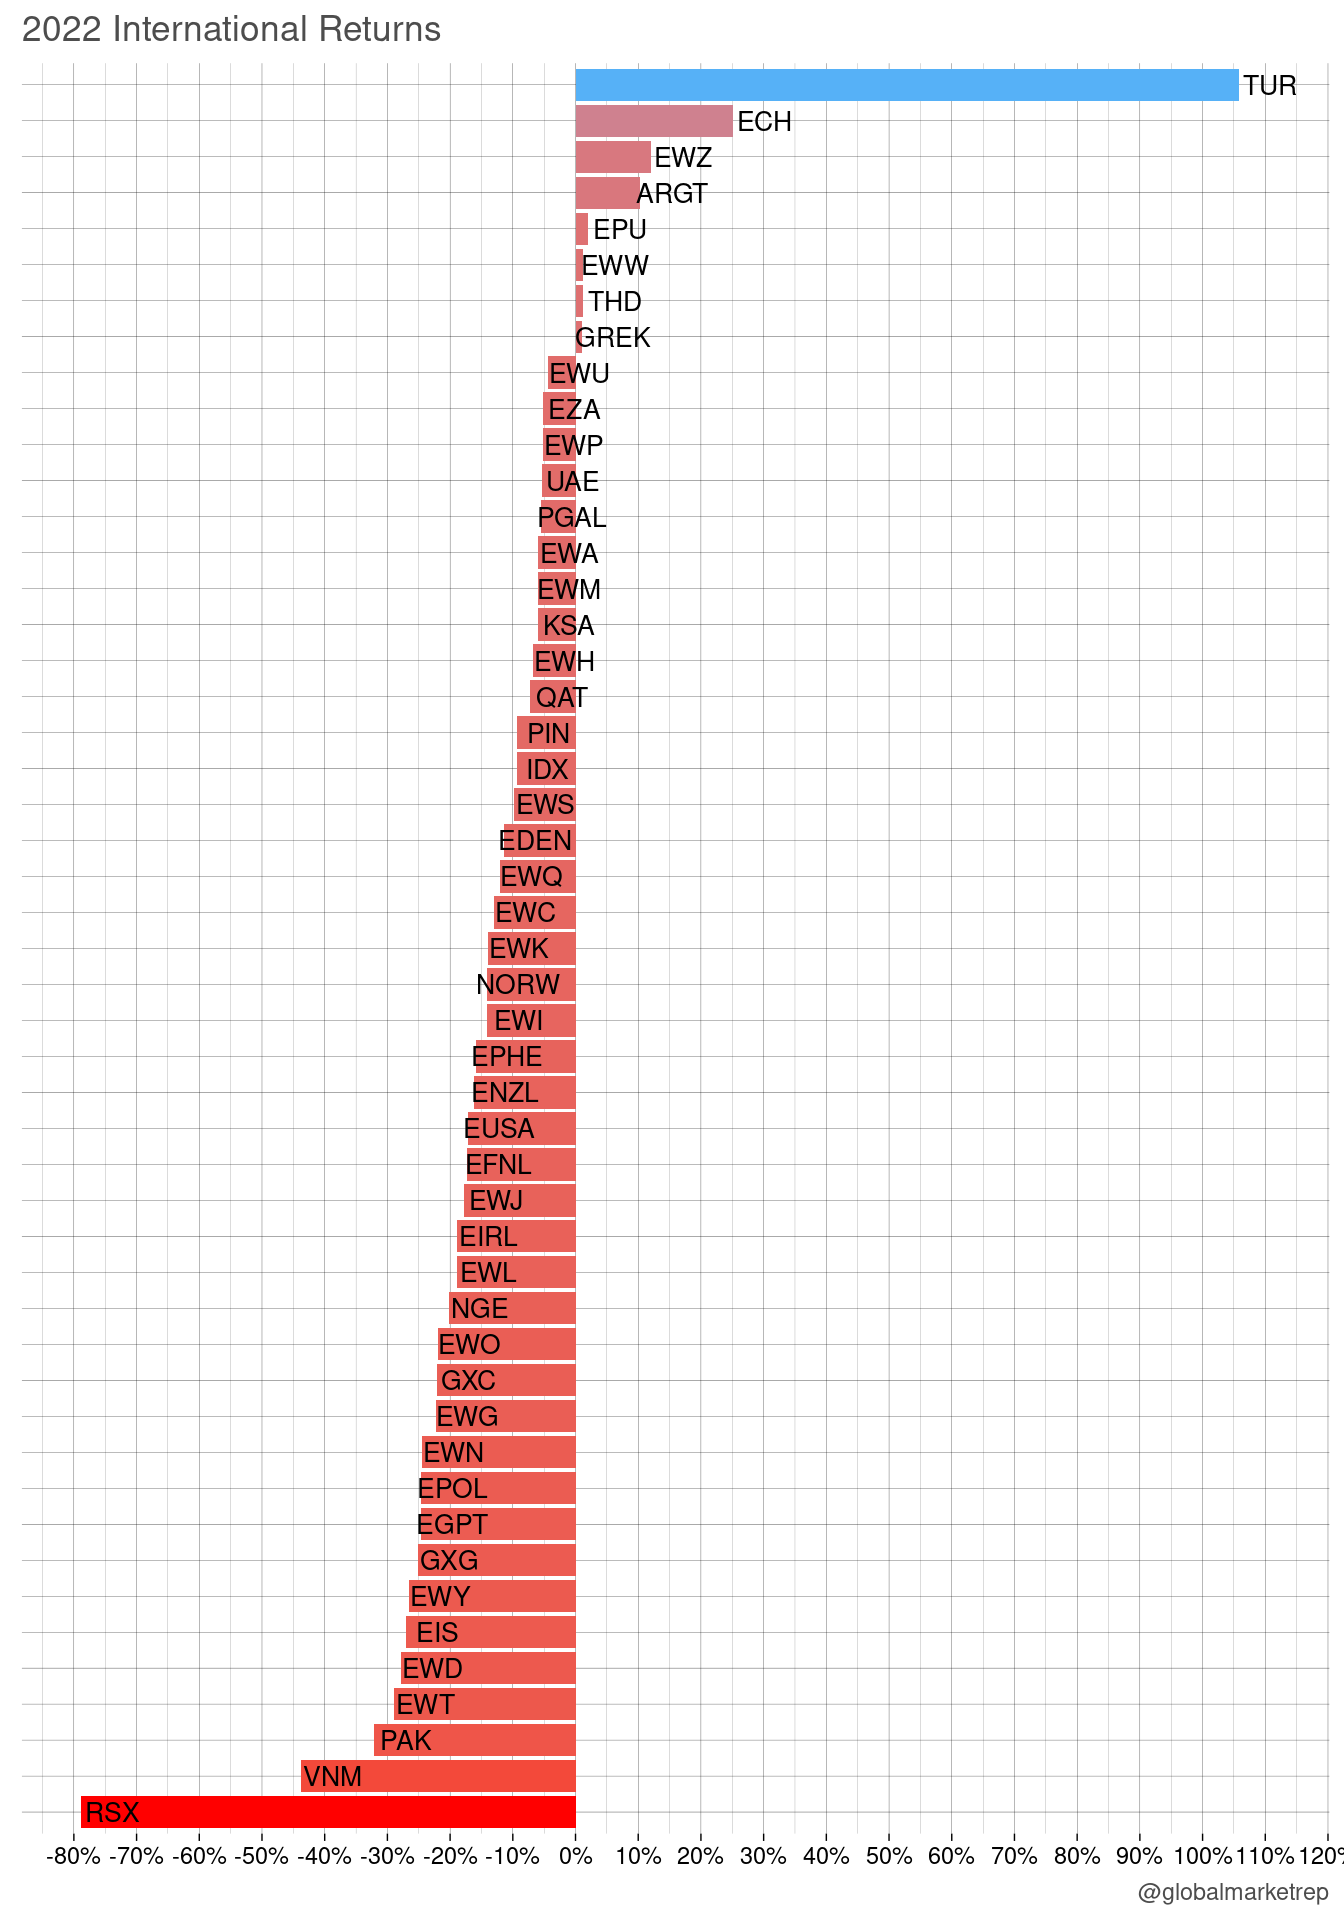
On the international scene, we see a lot of divergence. The winner by far has been Turkey (TUR), the problem child of the world economy. While not claiming that Turkey has solved its problems, in hindsight it becomes clear that the sell-offs have been exaggerated. A second winner has been Chile (ECH), another market that has lost significant value since the 2010s and therefore started the year with a great discount to be made up for. A similar situation is seen in Argentina (ARGT), Brazil (EWZ), Peru (EPU), and to some extent Greece (GREK, the tail light of European economies).
Interestingly, Mexico (EWW) managed to maintain its value. This could be explained by the move away from China (GXC) imports and the strengthening of domestic production in the US, which of course requires pre-products. This effect probably also played in favor of other Latin American markets mentioned above.
On the losing side, of course there is Russia (RSX) which became untradable shortly after the Russian invasion in February 2022. It has also been quite interesting to observe the fate of Vietnam (VNM), Pakistan (PAK), and Taiwan (EWT) - all countries that were highly praised during the China trade war (Trump era). Many were expecting these economies to take China’s place as a supplier for the US, and as a result, their stock market value skyrocketed. As seen after 2022, this hope was not fulfilled.
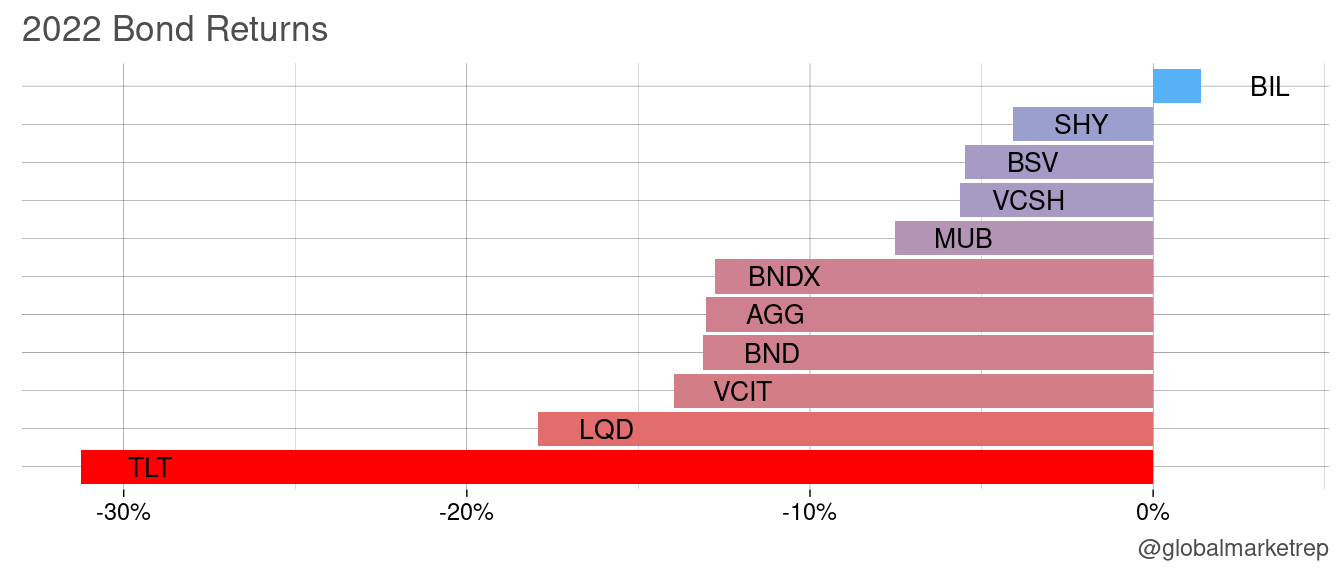
In the bond market, short-term T-bills (BIL) had a positive return for the year. As expected, when interest rates rise, bonds with longer durations tend to perform worse, with long-term treasury bonds (TLT, 20+Y) being the most affected.
Martin
Trying to make sense of economics and finance. Trading strategies, quant, risk-on/off, macro, global view.